Smarter Decisions Start Here
Experience the Power of AI in Financial Analysis


Unlock insights that go beyond traditional data with iCFO Pro’s AI-enhanced tools. Our newly integrated Industry Metrics and Business Performance Scorecard modules combine the depth of our financial dataset with the precision of artificial intelligence to deliver actionable intelligence. Now, you can provide your clients with strategic guidance tailored to their industry, region, and unique challenges.
Feature Comparison Table
Feature
Industry Metrics
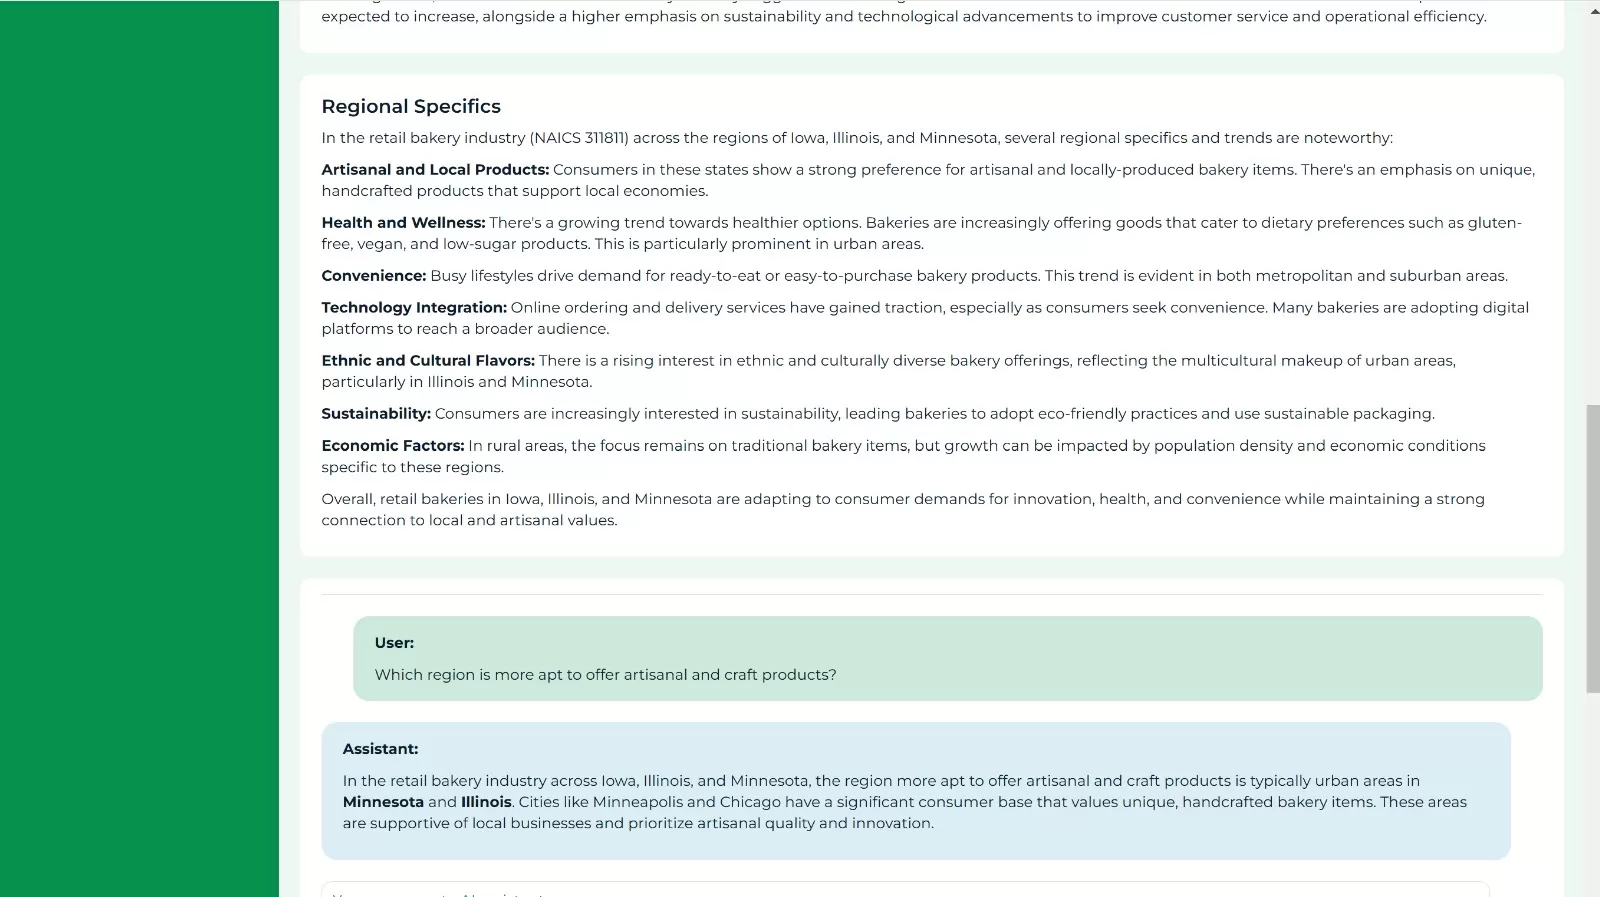
Regional Insights
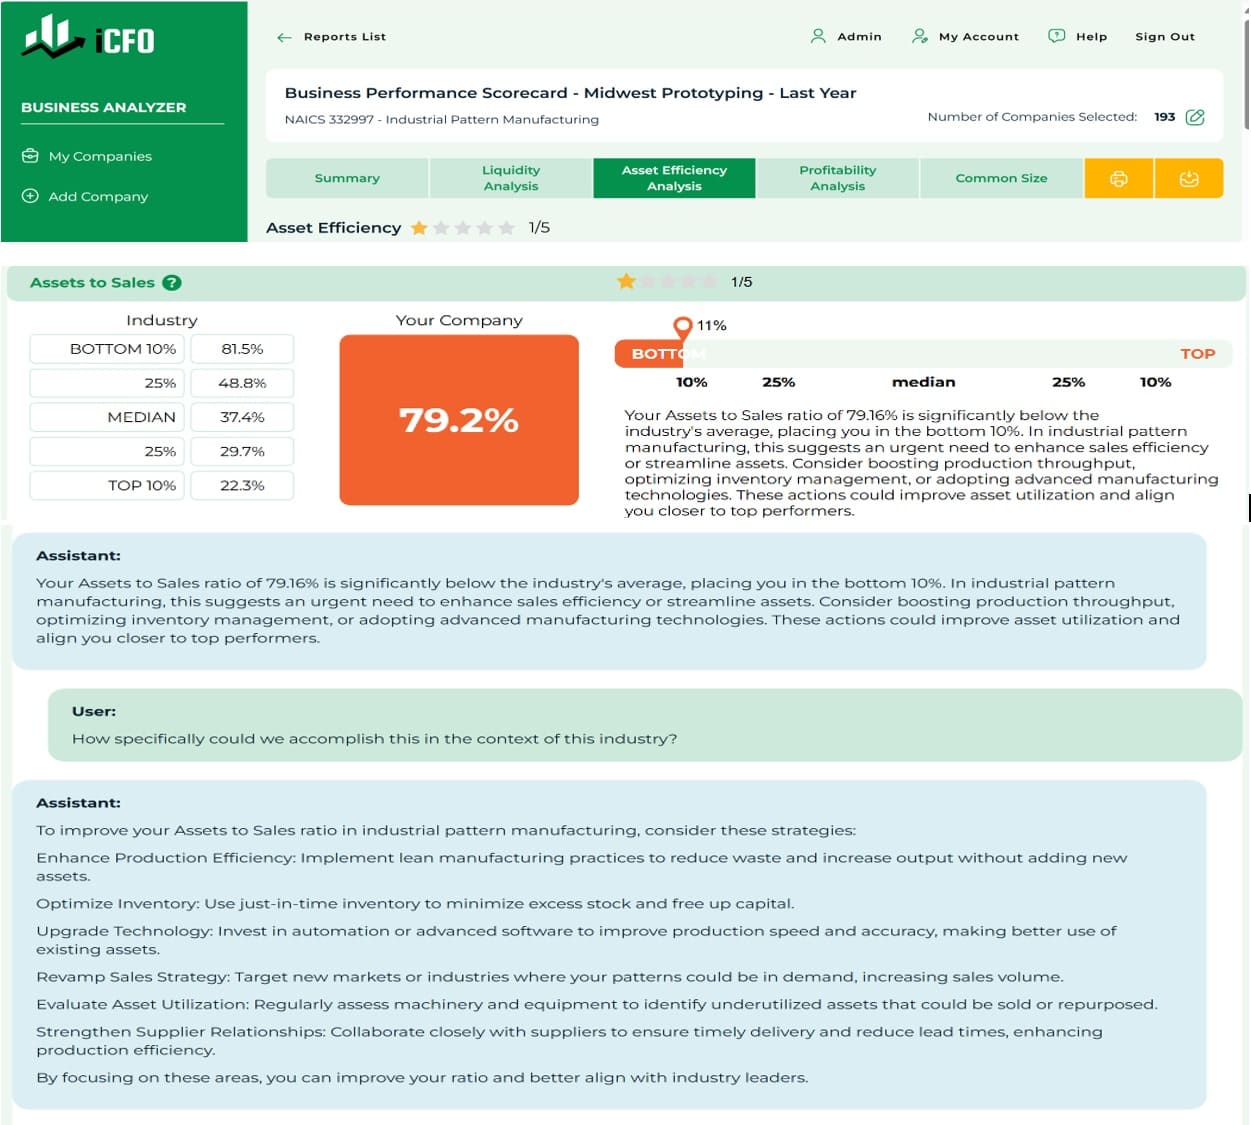
Business Performance Scorecard
User Interaction
Data Scope
Standard Reports
Provides historical trends and benchmarks.
General data for broad regions.
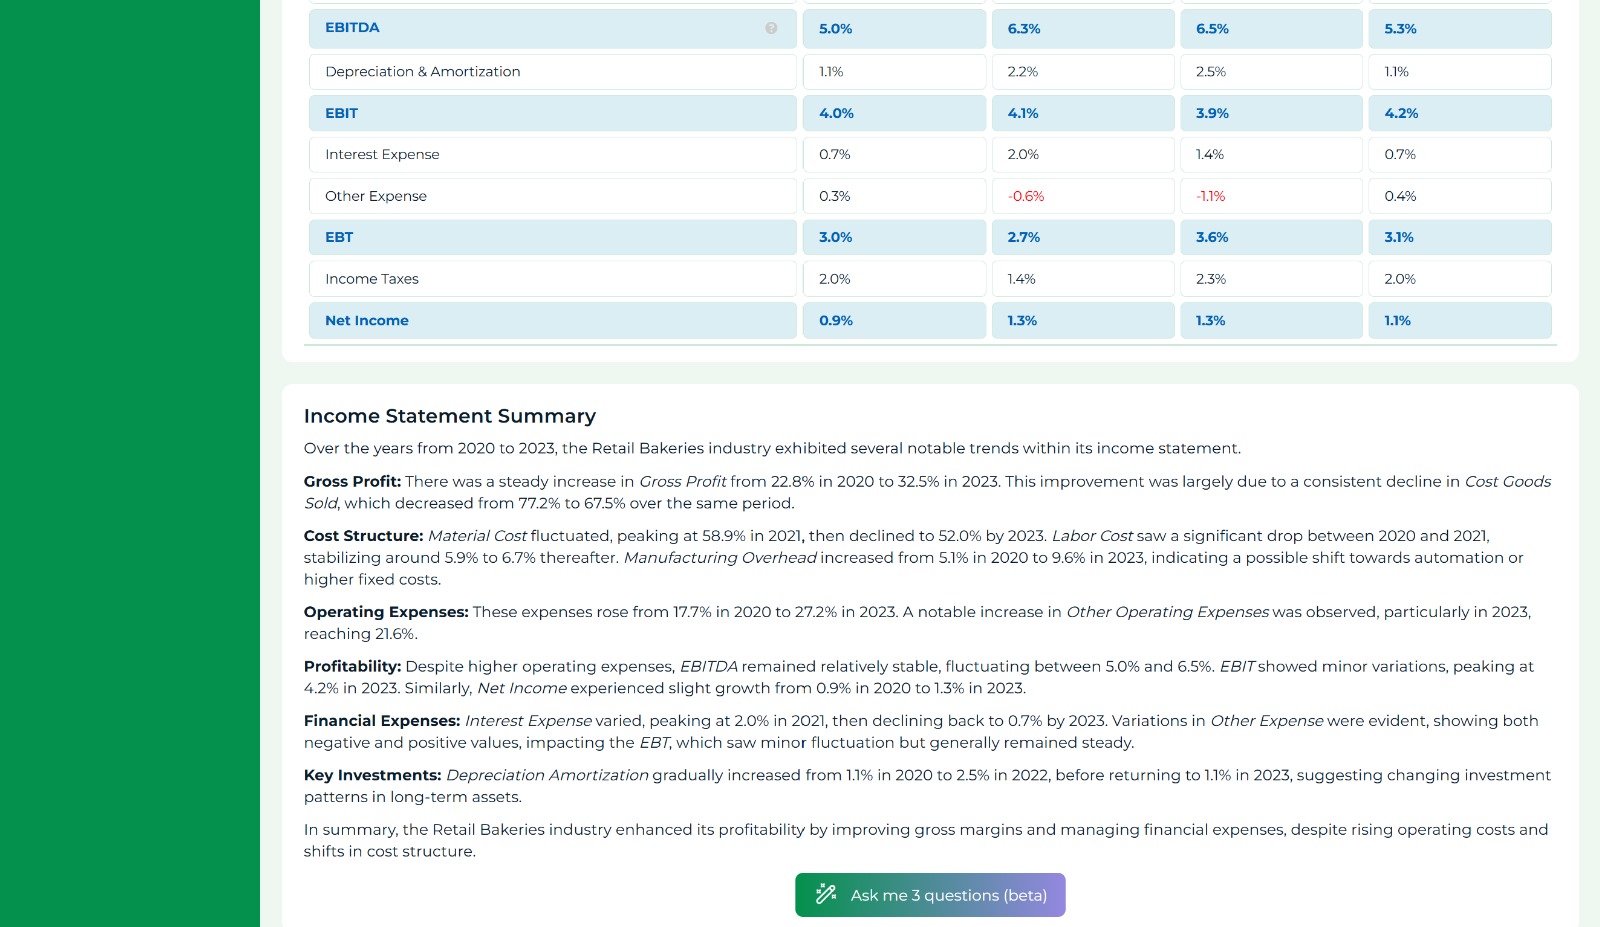
Static metrics such as profitability, liquidity, and growth.
Predefined report structure.
Historical financial ratios and performance metrics.
AI-Enhanced Reports
Offers predictive insights and identifies emerging industry trends.
Tailored, granular insights for specific states or metropolitan areas.
Interactive insights with recommendations for improvement based on AI.
Dynamic AI chat interface to ask specific questions and get instant answers.
Includes market trends, customer preferences, and localized economic drivers.
Introducing AI-Enhanced Financial Tools for Industry Experts
Stay ahead of the curve with iCFO Pro’s new AI-powered reports. Our enhanced Industry Metrics and Business Performance Scorecard tools deliver insights tailored to your industry and region, helping you make faster, smarter decisions. Whether you’re an SBDC counselor, consultant, or accountant, this is the intelligence you need to guide your clients toward success.
Understand What Drives Your Market
With our AI-driven regional analysis, you’ll gain a competitive edge by understanding the nuances of your specific market. For example:
- Illinois: Insights into the booming artisanal bakery sector, driven by demand for locally sourced ingredients.
- Michigan: A focus on craft bakeries and eco-friendly practices in urban centers like Detroit and Grand Rapids.
Discover trends that matter to your clients and tailor your strategies with precision.
Ask Questions. Get Answers
Our interactive AI chat interface allows you to go beyond standard reports. Ask specific questions, such as:
- “What are the profitability trends in Michigan’s bakery sector?”
- “How does my client’s liquidity compare to industry benchmarks in Illinois?” Receive instant, actionable insights tailored to your needs.

Be Among the First to Experience AI-Enhanced Reporting
Ready to see how AI can transform the way you analyze and advise? Get your industry report and experience the future of financial intelligence.
Testimonials
FAQ
The AI-enhanced Industry Metrics reports allow you to access tailored insights about your industry and region. You can ask up to three specific questions about industry trends, financial metrics, or regional comparisons, and the AI will provide instant, actionable answers. This saves time and helps you focus on strategic decision-making.
Once you generate your Industry Metrics report, a chat box will appear where you can type your questions. Simply ask anything about the trends, metrics, or comparisons shown in the report. For example:
- “What are the biggest challenges for convenience stores in Illinois?”
- “Why was inventory turnover so low in 2020 compared to other years?”
The AI will analyze the report data and provide detailed responses.
You can ask the AI questions related to:
- Industry trends: e.g., “What factors drove profitability in 2023?”
- Regional specifics: e.g., “How do Michigan and Illinois compare in terms of growth potential?”
- Financial metrics: e.g., “What caused fluctuations in cash flow from 2020 to 2023?”
The AI is designed to provide meaningful, context-specific answers based on the data in your report.
Yes! The AI can provide comparative insights. For example:
- “How does profitability in convenience stores compare between Illinois and Michigan?”
- “Which region has the highest growth potential for my industry?”
These comparisons make it easier to identify opportunities and challenges.
Currently, AI assistance is available for reports generated in the beta version of our Industry Metrics tool. As we continue to expand the feature, it will also be integrated into our Business Performance Scorecard and other modules soon.
The AI uses advanced algorithms trained on extensive financial and industry datasets. It provides insights based on the data and trends presented in your report. While highly accurate, its responses are meant to support—not replace—your professional judgment.
Yes! The AI allows you to refine your questions or ask follow-ups to dive deeper into specific topics. For example, if you ask, “Why were liabilities so low in 2020?” you can follow up with, “What market conditions contributed to this?”
You can ask up to three questions per report during the beta phase. This allows you to explore key aspects of the report data while we gather feedback to improve the feature.
The AI saves you time by providing immediate answers to complex questions, eliminating the need for manual data interpretation. It enhances your ability to deliver tailored insights to clients, helping you focus on strategic planning and decision-making.
If the AI’s response isn’t clear or doesn’t fully address your query, try rephrasing the question for more precision. For example:
- Instead of: “Why was growth slow in 2020?”
- Try: “What factors influenced the low revenue growth in 2020 compared to other years?”
You can also contact our support team for further assistance.
Yes! We are continuously improving our AI to provide deeper insights and better user interactions. Soon, AI features will be integrated into other tools like the Business Performance Scorecard, Profitability Analysis, and Growth Potential modules.
Absolutely. Your data is handled within a secure framework, ensuring confidentiality and compliance with data protection standards. AI responses are generated solely based on the report data and are not shared externally.


