
iCFO – Industry Benchmarking &
Financial Research
Platform
at Your Fingertips

One-Year & Four-Year
Financial Ratios for
Industry Trend
Analysis
View financial trends for your industry and understand how important accounts and ratios get impacted across different company sizes.
Reports $99 – $149 each.
Download Free Sample 1-year Report and 4-year Report
Explore Industry
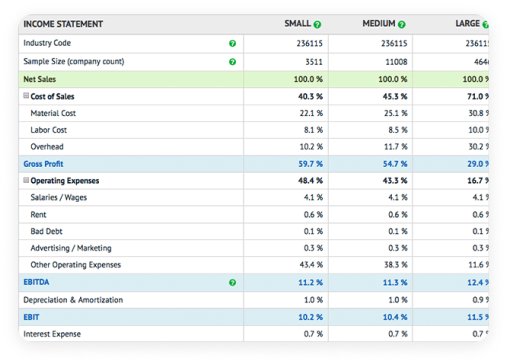
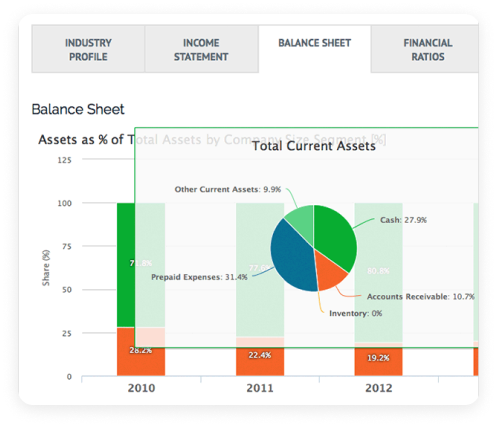
Income Statements &
Balance Sheets for
Market Analysis
View itemized Income Statement and Balance Sheet accounts in % or U.S. Dollar, in table and chart views, including Financial Ratios across Liquidity, Asset Efficiency and Profitability.
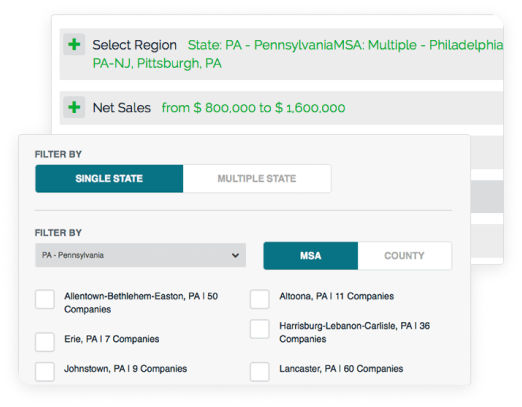
Use Regional & Sector
Analysis for Accurate
Financial Benchmarking
Perform a Regional Analysis for any report type, by selecting State, County, Metropolitan Statistical Area, or customizable cluster. Ensure relevant companies are used in your analysis by setting parameters in Net Sales, Total Assets, Age of Firm, and Number of Employees.
Benchmarking &
Financial Research
Tools for Business and Market Insights
iCFO offers a wide range of business analytics, key performance indicators, reports & practical recommendations, including industry peer benchmarking.

Included Features: Industry Statistics, Sector Analysis, and Ratio Reporting Tools
Business Performance
Scorecard
Review a snapshot of your company’s financial state – liquidity, profitability, asset efficiency, and growth – compared to industry peers
Industry
Metrics
View annual financials, median statistics, charts, ratios and more of your industry competitors or peer groups.
Business
Risk
Review your company’s financial health and its ability to weather typical market fluctuations, accurately determining its viability.
Loan
Risk
Assess a business’s financial viability and its ability to repay new debt obligations, allowing for quick and effective loan decisions.
Liquidity
Analyze your Liquidity position using an innovative proprietary measure determining working capital needs while modeling ways to improve cash sufficiency.
Financial Statement
Spreading
Review your company’s financial health and its ability to weather typical market fluctuations, accurately determining its viability.
Profitability
Evaluate your Profitability performance and model “what-if” scenarios designed to help improve performance and placement amongst industry peers.
Business
Valuation
Evaluate your company’s market value using commonly used valuation techniques aided by insightful comparison to industry peers.
Growth
Potential
Determine a company’s Sustainable Growth Rate and model “what-if” scenarios designedto improve SGR and placement amongst industry peers.