The Evolution of Financial Dashboards: How to Make Them Work for You

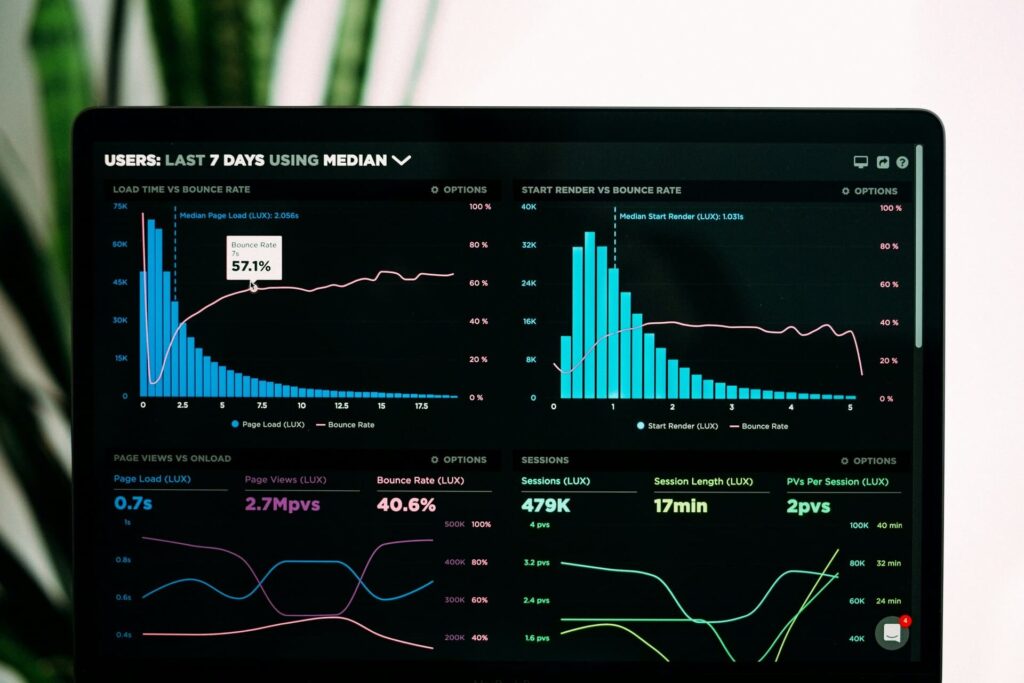
In the fast-paced rhythm of modern business, financial dashboards have become an indispensable means of observing, analyzing, and managing financial performance management. The dynamics in the world of financial dashboards have so far transformed how companies track crucial metrics—from static spreadsheets to dynamic, real-time financial reporting tools of today. This article will consider the development of financial dashboards and explore how businesses can effectively utilize this tool in driving informed decisions that lead to performance optimization.
From Spreadsheets to Real-Time Analytics: The Evolution of Financial Dashboards
The idea of financial dashboards has been in circulation for quite some time and has undergone various evolutions. For a long period, tracking finances was done manually on static sheets, which wouldn’t allow for easy or swift judgment about the same critical indicators. As businesses started scaling up, their finances began to grow big and complex; faster solutions were required.
The late 1990s and early 2000s would prove to be a huge turning point with the shift to digital dashboards. These were interactive digital tools that allowed business owners to visualize data in much better ways, including being able to drill down into particular metrics. The reach and functionality expanded with the advent of cloud-based financial tools and real-time analytics.
Some of the current trends in finance technology today include AI-driven insights, predictive analytics, and automated reporting, further extending the value of financial dashboards as effective decision-making tools.
Key Features of Modern Financial Dashboards
Modern financial dashboards possess a set of powerful features that businesses can leverage to track and optimize their performance. Among the key capabilities are:
- Data integration: Financial dashboards pull data from diverse sources with a unified view of key metrics.
- Real-time updates: With real-time financial reporting, businesses can make quick decisions based on the most up-to-date information.
- Customizable KPIs: Businesses can tailor dashboards to focus on the KPIs that matter most to their goals and objectives.
Advanced functionalities also play a crucial role in today’s dashboards:
- Predictive analytics: Using historical data, dashboards can provide forecasts and trends to help businesses anticipate future outcomes.
- Automated reporting: This eliminates the need for manual data entry and report generation, allowing for greater efficiency.
Popular financial dashboard platforms like Tableau and Power BI enable businesses to customize and integrate financial data, enhancing their decision-making process.
How Financial Dashboards Drive Business Decisions
Financial dashboards are more than data visualization tools; they drive actionable business insights. By providing a clear view of cash flow, profitability, and budget variance, dashboards help businesses make informed decisions.
These tools allow businesses to:
- Monitor cash flow and profitability in real-time.
- Assess budget variance to ensure financial plans are on track.
- Spot growth opportunities and mitigate risks with data-driven insights.
For example, a retail company could utilize a business analytics dashboard to study the performance of sales in different regions with the intention of making any necessary changes to its pricing strategy. The business analytics dashboard helps an organization know which products are successful and where improvement will be needed.
Best Practices to Build and Utilize Financial Dashboards
The development of an effective financial dashboard requires great detail. Key Steps for dashboard design:
- Choose applicable KPIs: Based on your business goals and objectives, choose the KPIs.
- Ensure data preciseness: Ensure that accurate and up-to-date data is fed on the dashboard.
- Create user-friendly interfaces: In developing dashboards, the simplicity of the design should not make it difficult for users to use.
It’s also very important to avoid common mistakes, such as overloading the dashboard with data or not taking user feedback into consideration. Paying attention to the most relevant metrics will guarantee that the dashboard will be a helpful tool in making decisions.
Future Trends in Financial Dashboards
With technology continuously changing, the future of financial dashboards seems bright. Up-and-coming trends include:
- AI and machine learning will make the dashboards even more intuitive, proactive in insights to predict financial outcomes rather than reporting on past data.
- Integration of Blockchain: This could mean a step up in transparency and security of financial data.
- Mobile Dashboards: Mobile applications will let businesses monitor financial performance and make decisions while on the go, further enhancing accessibility.
These are the trends that will revolutionize the way businesses interface with financial data, making it more usable and facilitating real-time decisions.
Conclusion: The Future of Financial Dashboards
From the static spreadsheet-based solution, financial dashboards have really evolved. In the same way that technology keeps expanding its capabilities, so too will financial dashboards. With the use of modern cloud-based financial tools and leveraging real-time analytics to full potential, businesses can gain deeper business insights into their businesses and make wiser decisions. Be it KPI tracking, automated reporting, or business analytics dashboards, financial dashboards are an indispensable part of modern business management.
It’s no longer an option but an absolute necessity to upgrade or adopt an advanced financial dashboard if any business has to survive and prosper in the ever-growing competitive market.
